Franklin India Dividend Yield Fund-Growth Plan
(Erstwhile Templeton India Equity Income Fund-Growth Plan)
| Category: Equity: Dividend Yield |
| Launch Date: 18-05-2006 |
| Asset Class: Equity |
| Benchmark: NIFTY 500 TRI |
| Expense Ratio: 2.09% As on (28-11-2025) |
| Status: Open Ended Schemes |
| Minimum Investment: 5000.0 |
| Minimum Topup: 1000.0 |
| Total Assets: 2,384.36 Cr As on (28-11-2025) |
| Turn over: 9.13% |
139.4653
0.79 (0.5653%)
14.4%
NIFTY 500 TRI 12.45%
PERFORMANCE of Franklin India Dividend Yield Fund-Growth Plan
Scheme Performance (%)
Data as on - 12-12-2025Yearly Performance (%)
Fund Managers
Rajasa Kakulavarapu, Ajay Argal,Sandeep Manam (Dedicated Foreign Fund Manager)
Investment Objective
To provide a combination of regular income and long-term capital appreciation by investing primarily in stocks that have a current or potentially attractive dividend yield, by using a value strategy.
NAV & Lumpsum details( Invested amount 1,00,000)
| NAV Date | NAV | Units | Market Value |
Returns (%) |
|---|---|---|---|---|
| 18-05-2006 | 10.0 | 10000.0 | 100000 | 0.0 % |
| 19-06-2006 | 9.12 | - | 91200 | -8.8 % |
| 18-07-2006 | 9.16 | - | 91600 | -8.4 % |
| 18-08-2006 | 9.9 | - | 99000 | -1.0 % |
| 18-09-2006 | 10.28 | - | 102800 | 2.8 % |
| 18-10-2006 | 10.88 | - | 108800 | 8.8 % |
| 20-11-2006 | 11.19 | - | 111900 | 11.9 % |
| 18-12-2006 | 11.6 | - | 116000 | 16.0 % |
| 18-01-2007 | 12.18 | - | 121800 | 21.8 % |
| 19-02-2007 | 12.59 | - | 125900 | 25.9 % |
| 19-03-2007 | 11.37 | - | 113700 | 13.7 % |
| 18-04-2007 | 12.3379 | - | 123379 | 23.38 % |
| 18-05-2007 | 13.0979 | - | 130979 | 30.98 % |
| 18-06-2007 | 13.1936 | - | 131936 | 31.94 % |
| 18-07-2007 | 14.3498 | - | 143498 | 43.5 % |
| 20-08-2007 | 13.1298 | - | 131298 | 31.3 % |
| 18-09-2007 | 14.2887 | - | 142887 | 42.89 % |
| 18-10-2007 | 16.3287 | - | 163287 | 63.29 % |
| 19-11-2007 | 17.511 | - | 175110 | 75.11 % |
| 18-12-2007 | 17.3318 | - | 173318 | 73.32 % |
| 18-01-2008 | 16.6736 | - | 166736 | 66.74 % |
| 18-02-2008 | 15.813 | - | 158130 | 58.13 % |
| 18-03-2008 | 14.075 | - | 140750 | 40.75 % |
| 21-04-2008 | 15.6302 | - | 156302 | 56.3 % |
| 20-05-2008 | 16.7733 | - | 167733 | 67.73 % |
| 18-06-2008 | 15.5556 | - | 155556 | 55.56 % |
| 18-07-2008 | 13.6936 | - | 136936 | 36.94 % |
| 18-08-2008 | 14.4096 | - | 144096 | 44.1 % |
| 18-09-2008 | 12.5525 | - | 125525 | 25.52 % |
| 20-10-2008 | 9.5029 | - | 95029 | -4.97 % |
| 18-11-2008 | 8.0425 | - | 80425 | -19.57 % |
| 18-12-2008 | 8.9708 | - | 89708 | -10.29 % |
| 19-01-2009 | 8.58 | - | 85800 | -14.2 % |
| 18-02-2009 | 8.1708 | - | 81708 | -18.29 % |
| 18-03-2009 | 8.4484 | - | 84484 | -15.52 % |
| 20-04-2009 | 10.3884 | - | 103884 | 3.88 % |
| 19-05-2009 | 12.8323 | - | 128323 | 28.32 % |
| 18-06-2009 | 13.2345 | - | 132345 | 32.34 % |
| 20-07-2009 | 14.2244 | - | 142244 | 42.24 % |
| 18-08-2009 | 14.7979 | - | 147979 | 47.98 % |
| 18-09-2009 | 16.4294 | - | 164294 | 64.29 % |
| 20-10-2009 | 16.9039 | - | 169039 | 69.04 % |
| 18-11-2009 | 16.8512 | - | 168512 | 68.51 % |
| 18-12-2009 | 17.3376 | - | 173376 | 73.38 % |
| 18-01-2010 | 18.5965 | - | 185965 | 85.97 % |
| 18-02-2010 | 17.306 | - | 173060 | 73.06 % |
| 18-03-2010 | 18.2768 | - | 182768 | 82.77 % |
| 19-04-2010 | 18.3551 | - | 183551 | 83.55 % |
| 18-05-2010 | 17.8566 | - | 178566 | 78.57 % |
| 18-06-2010 | 17.8185 | - | 178185 | 78.19 % |
| 19-07-2010 | 18.4893 | - | 184893 | 84.89 % |
| 18-08-2010 | 19.7109 | - | 197109 | 97.11 % |
| 20-09-2010 | 21.4622 | - | 214622 | 114.62 % |
| 18-10-2010 | 22.0921 | - | 220921 | 120.92 % |
| 18-11-2010 | 21.7631 | - | 217631 | 117.63 % |
| 20-12-2010 | 21.7405 | - | 217405 | 117.41 % |
| 18-01-2011 | 21.606 | - | 216060 | 116.06 % |
| 18-02-2011 | 20.4464 | - | 204464 | 104.46 % |
| 18-03-2011 | 19.8683 | - | 198683 | 98.68 % |
| 18-04-2011 | 21.1684 | - | 211684 | 111.68 % |
| 18-05-2011 | 20.4096 | - | 204096 | 104.1 % |
| 20-06-2011 | 19.6206 | - | 196206 | 96.21 % |
| 18-07-2011 | 20.5077 | - | 205077 | 105.08 % |
| 18-08-2011 | 18.2973 | - | 182973 | 82.97 % |
| 19-09-2011 | 18.1493 | - | 181493 | 81.49 % |
| 18-10-2011 | 17.7447 | - | 177447 | 77.45 % |
| 18-11-2011 | 17.4868 | - | 174868 | 74.87 % |
| 19-12-2011 | 16.7749 | - | 167749 | 67.75 % |
| 18-01-2012 | 18.1292 | - | 181292 | 81.29 % |
| 21-02-2012 | 20.2148 | - | 202148 | 102.15 % |
| 19-03-2012 | 19.4952 | - | 194952 | 94.95 % |
| 18-04-2012 | 19.6061 | - | 196061 | 96.06 % |
| 18-05-2012 | 18.067 | - | 180670 | 80.67 % |
| 18-06-2012 | 18.4985 | - | 184985 | 84.98 % |
| 18-07-2012 | 19.6641 | - | 196641 | 96.64 % |
| 21-08-2012 | 20.5573 | - | 205573 | 105.57 % |
| 18-09-2012 | 20.7448 | - | 207448 | 107.45 % |
| 18-10-2012 | 21.4488 | - | 214488 | 114.49 % |
| 19-11-2012 | 21.5386 | - | 215386 | 115.39 % |
| 18-12-2012 | 22.9295 | - | 229295 | 129.3 % |
| 18-01-2013 | 23.6582 | - | 236582 | 136.58 % |
| 18-02-2013 | 22.974 | - | 229740 | 129.74 % |
| 18-03-2013 | 22.1243 | - | 221243 | 121.24 % |
| 18-04-2013 | 21.9085 | - | 219085 | 119.08 % |
| 20-05-2013 | 23.1393 | - | 231393 | 131.39 % |
| 18-06-2013 | 22.4122 | - | 224122 | 124.12 % |
| 18-07-2013 | 22.3633 | - | 223633 | 123.63 % |
| 19-08-2013 | 20.9068 | - | 209068 | 109.07 % |
| 18-09-2013 | 21.9451 | - | 219451 | 119.45 % |
| 18-10-2013 | 22.6969 | - | 226969 | 126.97 % |
| 18-11-2013 | 23.618 | - | 236180 | 136.18 % |
| 18-12-2013 | 23.6173 | - | 236173 | 136.17 % |
| 20-01-2014 | 23.5505 | - | 235505 | 135.5 % |
| 18-02-2014 | 23.3144 | - | 233144 | 133.14 % |
| 18-03-2014 | 24.1621 | - | 241621 | 141.62 % |
| 21-04-2014 | 25.1021 | - | 251021 | 151.02 % |
| 19-05-2014 | 26.6141 | - | 266141 | 166.14 % |
| 18-06-2014 | 29.3037 | - | 293037 | 193.04 % |
| 18-07-2014 | 29.7144 | - | 297144 | 197.14 % |
| 18-08-2014 | 31.0086 | - | 310086 | 210.09 % |
| 18-09-2014 | 32.6795 | - | 326795 | 226.79 % |
| 20-10-2014 | 32.0653 | - | 320653 | 220.65 % |
| 18-11-2014 | 33.4845 | - | 334845 | 234.85 % |
| 18-12-2014 | 32.5187 | - | 325187 | 225.19 % |
| 19-01-2015 | 34.0151 | - | 340151 | 240.15 % |
| 18-02-2015 | 34.8689 | - | 348689 | 248.69 % |
| 18-03-2015 | 33.5875 | - | 335875 | 235.88 % |
| 20-04-2015 | 34.2026 | - | 342026 | 242.03 % |
| 18-05-2015 | 34.6806 | - | 346806 | 246.81 % |
| 18-06-2015 | 33.5144 | - | 335144 | 235.14 % |
| 20-07-2015 | 34.3157 | - | 343157 | 243.16 % |
| 18-08-2015 | 34.2899 | - | 342899 | 242.9 % |
| 18-09-2015 | 32.4349 | - | 324349 | 224.35 % |
| 19-10-2015 | 33.3809 | - | 333809 | 233.81 % |
| 18-11-2015 | 32.8722 | - | 328722 | 228.72 % |
| 18-12-2015 | 32.6037 | - | 326037 | 226.04 % |
| 18-01-2016 | 30.212 | - | 302120 | 202.12 % |
| 18-02-2016 | 29.5326 | - | 295326 | 195.33 % |
| 18-03-2016 | 31.59 | - | 315900 | 215.9 % |
| 18-04-2016 | 32.8418 | - | 328418 | 228.42 % |
| 18-05-2016 | 32.5757 | - | 325757 | 225.76 % |
| 20-06-2016 | 33.7416 | - | 337416 | 237.42 % |
| 18-07-2016 | 35.1585 | - | 351585 | 251.58 % |
| 18-08-2016 | 36.31 | - | 363100 | 263.1 % |
| 19-09-2016 | 37.9071 | - | 379071 | 279.07 % |
| 18-10-2016 | 38.6523 | - | 386523 | 286.52 % |
| 18-11-2016 | 35.5901 | - | 355901 | 255.9 % |
| 19-12-2016 | 35.8464 | - | 358464 | 258.46 % |
| 18-01-2017 | 37.2943 | - | 372943 | 272.94 % |
| 20-02-2017 | 39.144 | - | 391440 | 291.44 % |
| 20-03-2017 | 39.9136 | - | 399136 | 299.14 % |
| 18-04-2017 | 40.6403 | - | 406403 | 306.4 % |
| 18-05-2017 | 41.7698 | - | 417698 | 317.7 % |
| 19-06-2017 | 42.4564 | - | 424564 | 324.56 % |
| 18-07-2017 | 43.5184 | - | 435184 | 335.18 % |
| 18-08-2017 | 43.6502 | - | 436502 | 336.5 % |
| 18-09-2017 | 46.0386 | - | 460386 | 360.39 % |
| 18-10-2017 | 46.2677 | - | 462677 | 362.68 % |
| 20-11-2017 | 46.6859 | - | 466859 | 366.86 % |
| 18-12-2017 | 47.148 | - | 471480 | 371.48 % |
| 18-01-2018 | 49.3505 | - | 493505 | 393.5 % |
| 19-02-2018 | 47.3919 | - | 473919 | 373.92 % |
| 19-03-2018 | 46.2013 | - | 462013 | 362.01 % |
| 18-04-2018 | 47.8484 | - | 478484 | 378.48 % |
| 18-05-2018 | 48.0417 | - | 480417 | 380.42 % |
| 18-06-2018 | 48.1077 | - | 481077 | 381.08 % |
| 18-07-2018 | 46.9823 | - | 469823 | 369.82 % |
| 20-08-2018 | 47.4643 | - | 474643 | 374.64 % |
| 18-09-2018 | 46.8549 | - | 468549 | 368.55 % |
| 19-10-2018 | 42.1682 | - | 421682 | 321.68 % |
| 19-11-2018 | 44.5362 | - | 445362 | 345.36 % |
| 18-12-2018 | 44.2945 | - | 442945 | 342.94 % |
| 18-01-2019 | 44.6595 | - | 446595 | 346.59 % |
| 18-02-2019 | 43.6316 | - | 436316 | 336.32 % |
| 18-03-2019 | 46.7645 | - | 467645 | 367.64 % |
| 18-04-2019 | 47.4941 | - | 474941 | 374.94 % |
| 20-05-2019 | 45.7608 | - | 457608 | 357.61 % |
| 18-06-2019 | 45.8834 | - | 458834 | 358.83 % |
| 18-07-2019 | 45.717 | - | 457170 | 357.17 % |
| 19-08-2019 | 43.9894 | - | 439894 | 339.89 % |
| 18-09-2019 | 44.6743 | - | 446743 | 346.74 % |
| 18-10-2019 | 45.9212 | - | 459212 | 359.21 % |
| 18-11-2019 | 45.4306 | - | 454306 | 354.31 % |
| 18-12-2019 | 45.6881 | - | 456881 | 356.88 % |
| 20-01-2020 | 47.8805 | - | 478805 | 378.81 % |
| 18-02-2020 | 46.0175 | - | 460175 | 360.18 % |
| 18-03-2020 | 34.1448 | - | 341448 | 241.45 % |
| 20-04-2020 | 37.0779 | - | 370779 | 270.78 % |
| 18-05-2020 | 35.3988 | - | 353988 | 253.99 % |
| 18-06-2020 | 39.991 | - | 399910 | 299.91 % |
| 20-07-2020 | 42.5877 | - | 425877 | 325.88 % |
| 18-08-2020 | 45.6416 | - | 456416 | 356.42 % |
| 18-09-2020 | 46.7481 | - | 467481 | 367.48 % |
| 19-10-2020 | 46.8975 | - | 468975 | 368.98 % |
| 18-11-2020 | 50.4696 | - | 504696 | 404.7 % |
| 18-12-2020 | 55.8481 | - | 558481 | 458.48 % |
| 18-01-2021 | 58.7374 | - | 587374 | 487.37 % |
| 18-02-2021 | 62.9694 | - | 629694 | 529.69 % |
| 18-03-2021 | 62.417 | - | 624170 | 524.17 % |
| 19-04-2021 | 63.0639 | - | 630639 | 530.64 % |
| 18-05-2021 | 67.1857 | - | 671857 | 571.86 % |
| 18-06-2021 | 71.969 | - | 719690 | 619.69 % |
| 19-07-2021 | 74.7407 | - | 747407 | 647.41 % |
| 18-08-2021 | 75.4195 | - | 754195 | 654.19 % |
| 20-09-2021 | 76.6317 | - | 766317 | 666.32 % |
| 18-10-2021 | 84.688 | - | 846880 | 746.88 % |
| 18-11-2021 | 82.2448 | - | 822448 | 722.45 % |
| 20-12-2021 | 78.741 | - | 787410 | 687.41 % |
| 18-01-2022 | 84.1462 | - | 841462 | 741.46 % |
| 18-02-2022 | 81.5977 | - | 815977 | 715.98 % |
| 21-03-2022 | 81.2475 | - | 812475 | 712.48 % |
| 18-04-2022 | 84.6709 | - | 846709 | 746.71 % |
| 18-05-2022 | 81.7979 | - | 817979 | 717.98 % |
| 20-06-2022 | 76.7216 | - | 767216 | 667.22 % |
| 18-07-2022 | 82.0065 | - | 820065 | 720.07 % |
| 18-08-2022 | 85.9718 | - | 859718 | 759.72 % |
| 19-09-2022 | 83.8609 | - | 838609 | 738.61 % |
| 18-10-2022 | 82.8724 | - | 828724 | 728.72 % |
| 18-11-2022 | 86.1491 | - | 861491 | 761.49 % |
| 19-12-2022 | 87.1377 | - | 871377 | 771.38 % |
| 18-01-2023 | 87.7607 | - | 877607 | 777.61 % |
| 20-02-2023 | 88.0797 | - | 880797 | 780.8 % |
| 20-03-2023 | 87.2827 | - | 872827 | 772.83 % |
| 18-04-2023 | 88.853 | - | 888530 | 788.53 % |
| 18-05-2023 | 90.0035 | - | 900035 | 800.03 % |
| 19-06-2023 | 92.4023 | - | 924023 | 824.02 % |
| 18-07-2023 | 95.7561 | - | 957561 | 857.56 % |
| 18-08-2023 | 95.7916 | - | 957916 | 857.92 % |
| 18-09-2023 | 101.0974 | - | 1010974 | 910.97 % |
| 18-10-2023 | 100.1756 | - | 1001756 | 901.76 % |
| 20-11-2023 | 102.2714 | - | 1022714 | 922.71 % |
| 18-12-2023 | 111.4359 | - | 1114359 | 1014.36 % |
| 18-01-2024 | 116.0677 | - | 1160677 | 1060.68 % |
| 19-02-2024 | 127.5701 | - | 1275701 | 1175.7 % |
| 18-03-2024 | 123.4504 | - | 1234504 | 1134.5 % |
| 18-04-2024 | 126.2192 | - | 1262192 | 1162.19 % |
| 21-05-2024 | 131.7622 | - | 1317622 | 1217.62 % |
| 18-06-2024 | 136.6034 | - | 1366034 | 1266.03 % |
| 18-07-2024 | 144.8991 | - | 1448991 | 1348.99 % |
| 19-08-2024 | 147.4437 | - | 1474437 | 1374.44 % |
| 18-09-2024 | 146.5443 | - | 1465443 | 1365.44 % |
| 18-10-2024 | 146.6939 | - | 1466939 | 1366.94 % |
| 18-11-2024 | 136.0456 | - | 1360456 | 1260.46 % |
| 18-12-2024 | 140.3872 | - | 1403872 | 1303.87 % |
| 20-01-2025 | 136.3685 | - | 1363685 | 1263.69 % |
| 18-02-2025 | 130.6814 | - | 1306814 | 1206.81 % |
| 18-03-2025 | 129.8431 | - | 1298431 | 1198.43 % |
| 21-04-2025 | 134.6217 | - | 1346217 | 1246.22 % |
| 19-05-2025 | 138.5765 | - | 1385765 | 1285.76 % |
| 18-06-2025 | 137.0282 | - | 1370282 | 1270.28 % |
| 18-07-2025 | 138.6764 | - | 1386764 | 1286.76 % |
| 18-08-2025 | 135.6495 | - | 1356495 | 1256.49 % |
| 18-09-2025 | 138.8413 | - | 1388413 | 1288.41 % |
| 20-10-2025 | 139.3372 | - | 1393372 | 1293.37 % |
| 18-11-2025 | 139.1349 | - | 1391349 | 1291.35 % |
| 12-12-2025 | 139.4653 | - | 1394653 | 1294.65 % |
RETURNS CALCULATOR for Franklin India Dividend Yield Fund-Growth Plan
Growth of 10000 In SIP (Fund vs Benchmark)
Growth of 10000 In LUMPSUM (Fund vs Benchmark)
Rolling Returns
Rolling returns are the annualized returns of the scheme taken for a specified period (rolling returns period) on every day/week/month and taken till the last day of the duration. In this chart we are showing the annualized returns over the rolling returns period on every day from the start date and comparing it with the benchmark. Rolling returns is the best measure of a fund's performance. Trailing returns have a recency bias and point to point returns are specific to the period in consideration. Rolling returns, on the other hand, measures the fund's absolute and relative performance across all timescales, without bias.
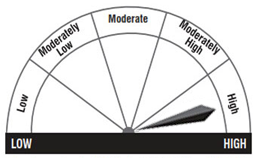
Riskometer
Key Performance and Risk Statistics of Franklin India Dividend Yield Fund-Growth Plan
| Key Statistics | Volatility | Sharpe Ratio | Alpha | Beta | Yield to Maturity | Average Maturity |
|---|---|---|---|---|---|---|
| Franklin India Dividend Yield Fund-Growth Plan | 11.15 | 0.86 | 2.57 | 0.79 | - | - |
| Equity: Dividend Yield | - | - | - | - | - | - |
PEER COMPARISION of Franklin India Dividend Yield Fund-Growth Plan
PORTFOLIO ANALYSIS of Franklin India Dividend Yield Fund-Growth Plan
Asset Allocation (%)
| Allocation | Percentage (%) |
|---|
Market Cap Distribution
Small Cap
15.63%
Others
23.55%
Large Cap
52.19%
Mid Cap
8.63%
Total
100%